Home / Spend Management Software
The AI-powered spend management suite
Bring your expenses, supplier invoices, and corporate card payments into one fully integrated platform, powered by AI technology.
Take control of your global spend
Yokoy Invoice
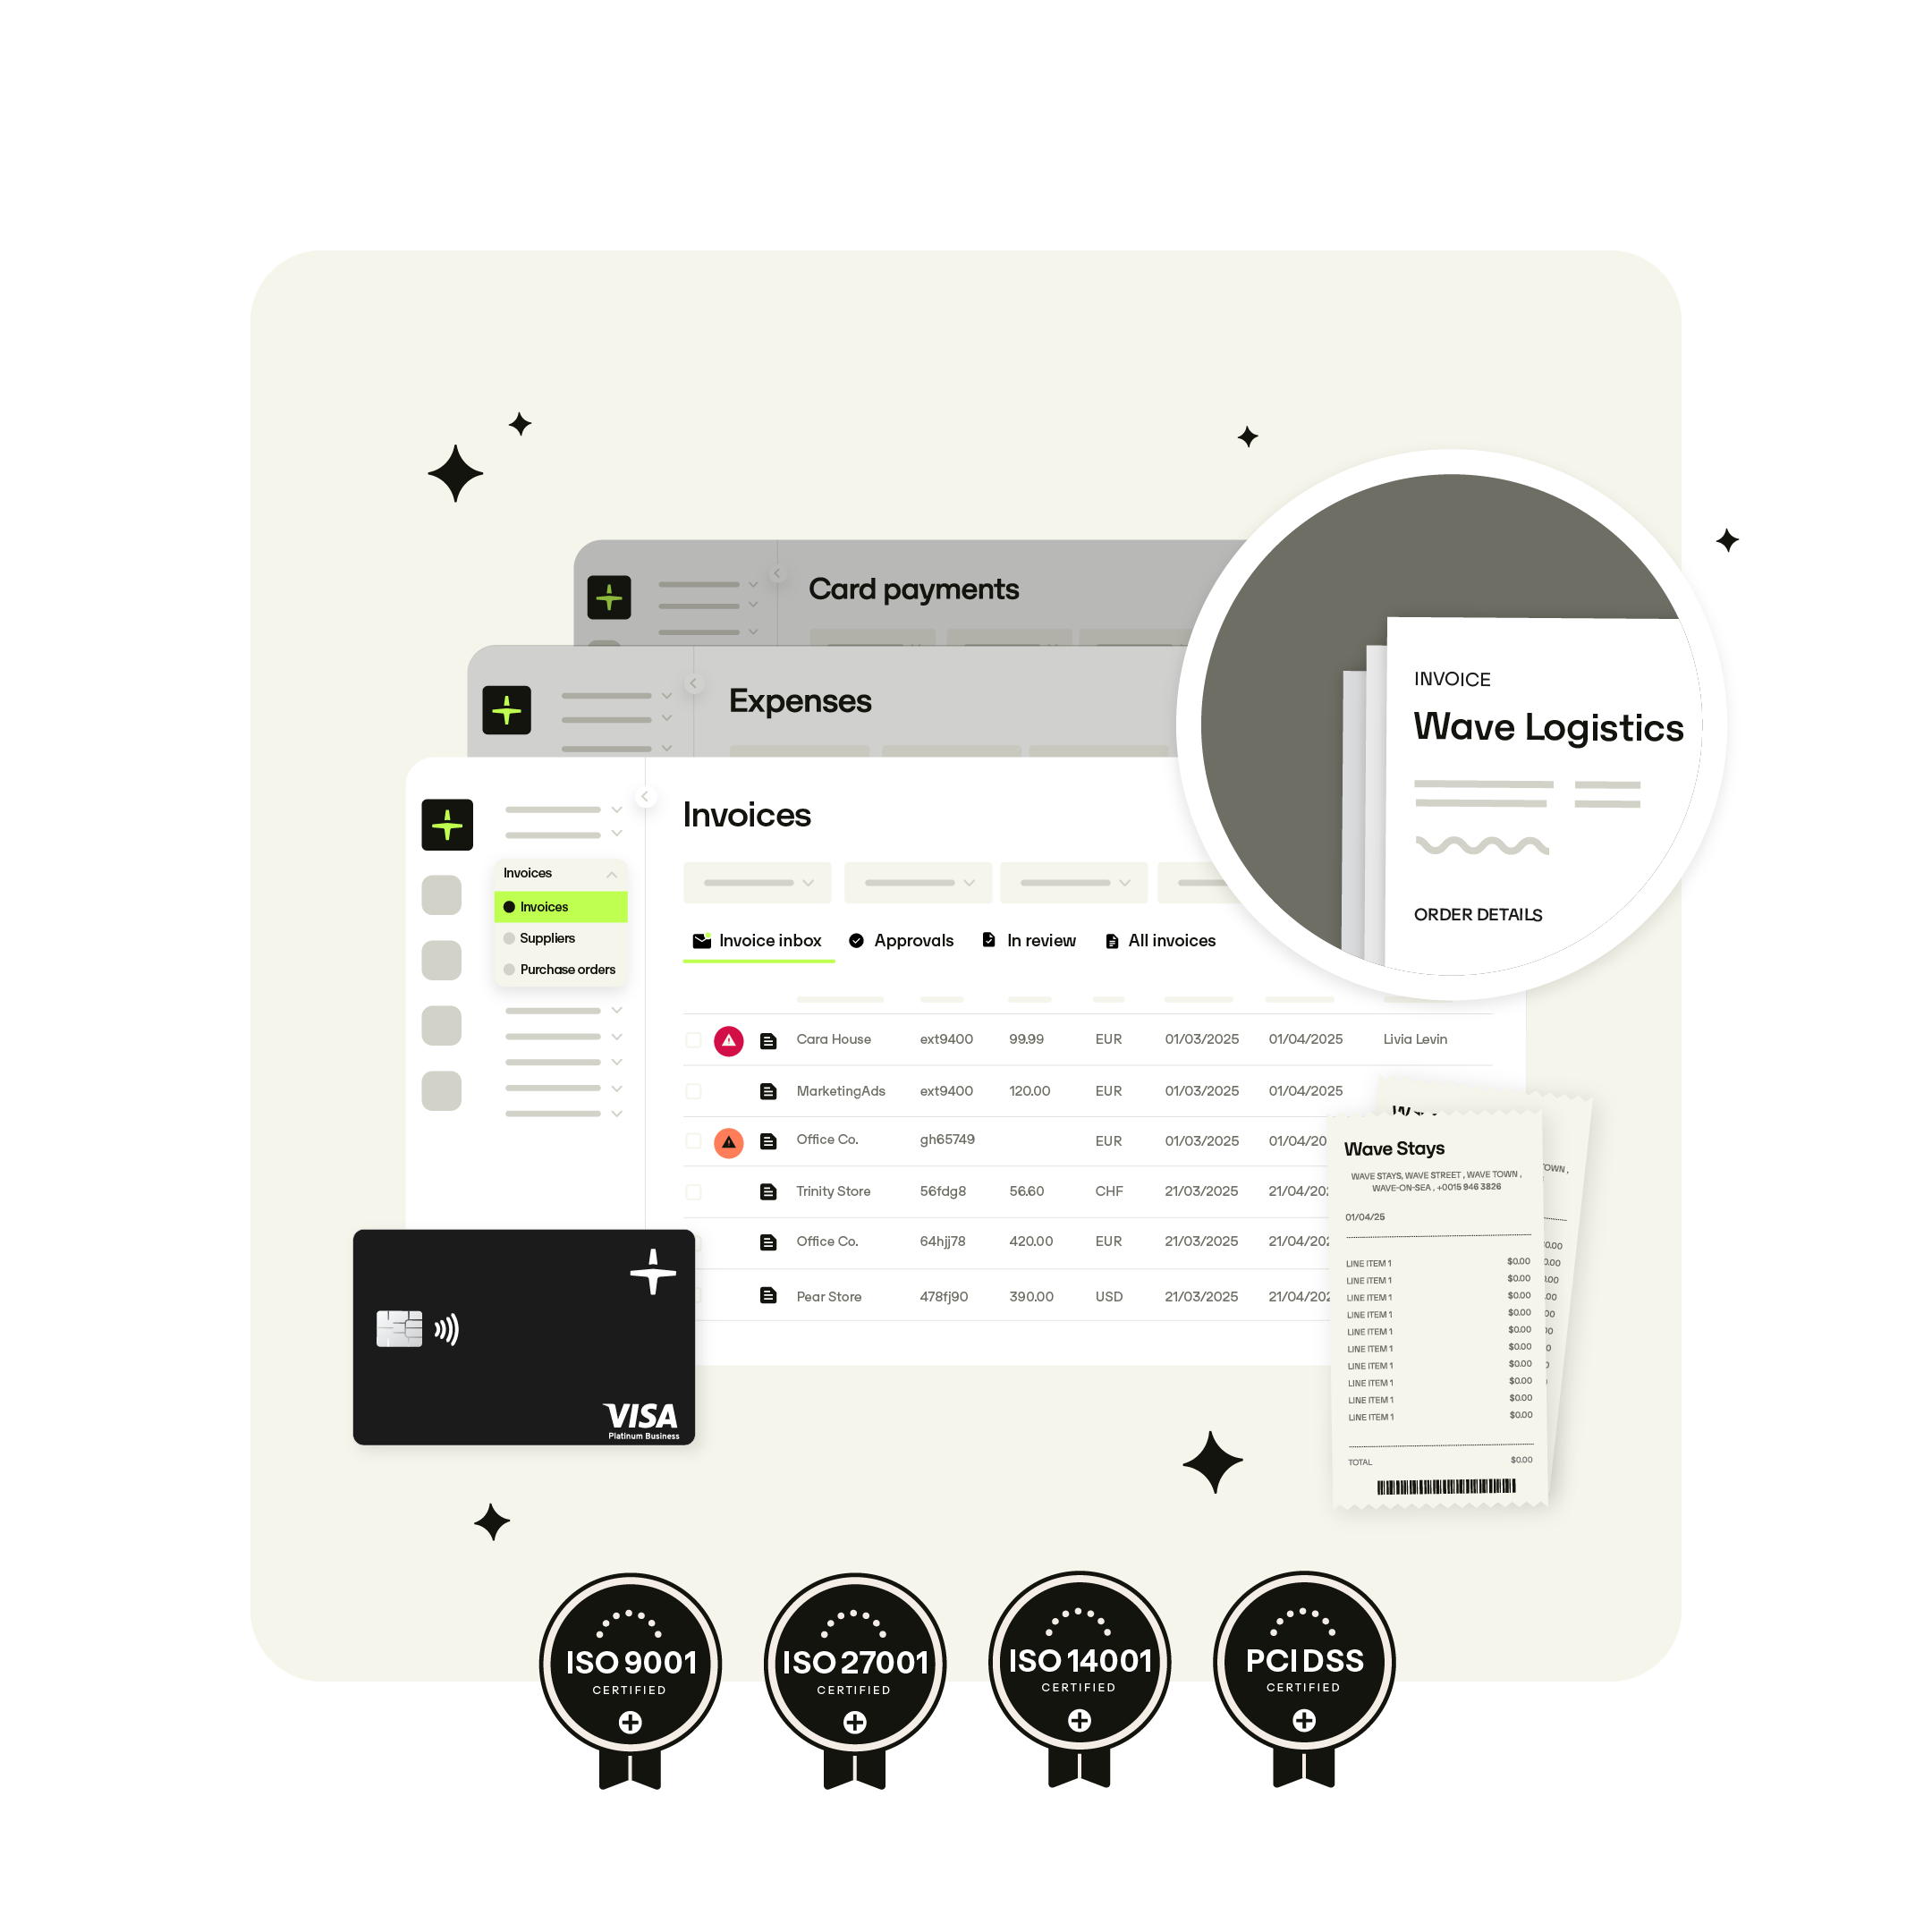
Process invoices automatically
Consolidate your accounts payable process, manage invoices at scale, automate approvals with custom workflows, and pay on time with Yokoy’s AI-powered invoice management solution.
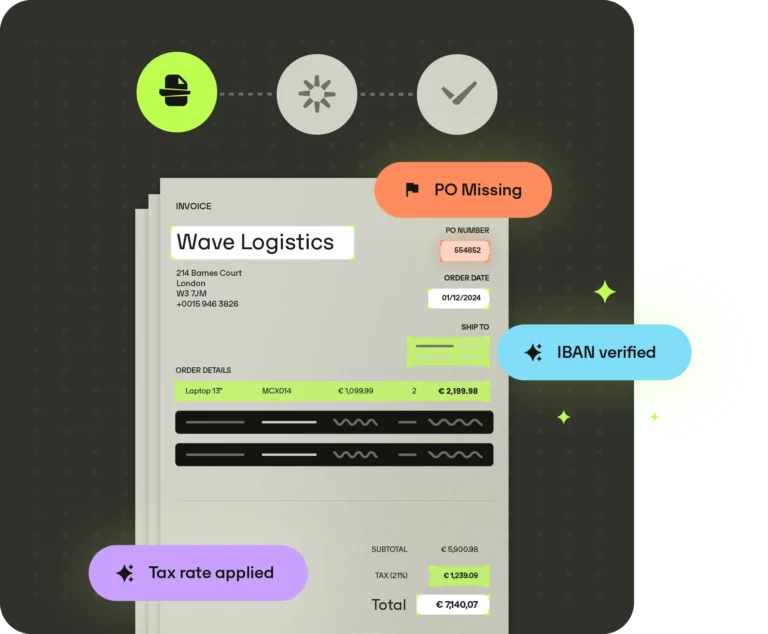
AI-based invoice data capture, extraction, and approval
Automated matching of invoices, POs, and good receipts data
Custom approval workflows for true AP automation
Real-time spend visibility and full spend control for global organizations

Yokoy Expense
Manage expenses effortlessly
Automate your expense management, simplify expense reporting, and prevent fraud and reimbursement delays with Yokoy’s AI-driven expense management solution.
Fully digital business expense reporting via web and mobile app
Automated matching of receipts and card transactions for real-time visibility
Real-time expense tracking and granular control over employee spending
Custom workflows and approval flows for fast reimbursements
Yokoy Pay
Streamline your business payments
Gain real-time control of your global card spend and automatically match card transactions with receipts with Yokoy’s smart payment solutions.
Issue physical and virtual cards on the go and easily freeze them via the Yokoy app
Granular spend controls and individual spending limits to prevent overspending
Automated transaction matching and real-time compliance checks
Real-time spend data analysis for simple reporting and cost savings insights

Stadler manages their global spend with Yokoy
"At Stadler Rail, we’ve automated our global expense management process with Yokoy. This means Yokoy’s Artificial Intelligence does the repetitive work for us and we only check outliers and exceptions manually, which saves us time and money."

Main features
Get to know our spend management solution.
AI-based automation
Eliminate manual work from your T&E and AP processes. Yokoy’s AI captures, extracts, validates, and approves employee expense and supplier invoices automatically.
End-to-end automation
Improve efficiency with AI automation and streamline operations by bringing all your processes into one central platform, fully integrated into your tech stack.
Custom approval flows
Map out your end-to-end approval workflows, customize them per entity, and define how exceptions should be handled, to reach full spend management automation.
Built-in compliance
Prevent overspending and fraud and ensure compliance with company policies and country-specific regulations through built-in rules and pre-approval flows.
Real-time reporting
Track expenses as they happen, extract spending patterns and insights from your analytics dashboards, and gain real-time visibility into your spending for accurate forecasts.
Simple audit trails
Detect errors and fraud with ease and ensure accurate audit trails by safely storing all your expense receipts, card transaction history, and vendor invoices in the Yokoy platform.
Multi entity support
Streamline complex AP and T&E processes across entities and subsidiaries, and standardize your workflows for increased efficiency and control with a central spend management platform.
World-class service and support
Get answers to your questions right away, troubleshoot issues with help from our experts, and improve your knowledge with in-depth live and self-guided Academy trainings.
Main features
Get to know our spend management solution.
AI-based automation
Eliminate manual work from your T&E and AP processes. Yokoy's AI captures, extracts, validates, and approves employee expense and supplier invoices automatically.
AI-based automation
Improve efficiency with AI automation and streamline operations by bringing all your processes into one central platform, fully integrated into your tech stack.
Custom approval flows
Map out your end-to-end approval workflows, customize them per entity, and define how exceptions should be handled, to reach full spend management automation.
Built-in compliance
Prevent overspending and fraud and ensure compliance with company policies and country-specific regulations through built-in rules and pre-approval flows.
Real-time reporting
Track expenses as they happen, extract spending patterns and insights from your analytics dashboards, and gain real-time visibility into your spending for accurate forecasts.
Simple audit trails
Detect errors and fraud with ease and ensure accurate audit trails by safely storing all your expense receipts, card transaction history, and vendor invoices in the Yokoy platform.
Multi entity support
Streamline complex AP and T&E processes across entities and subsidiaries, and standardize your workflows for increased efficiency and control with a central spend management platform.
World-class service and support
Get answers to your questions right away, troubleshoot issues with help from our experts, and improve your knowledge with in-depth live and self-guided Academy trainings.
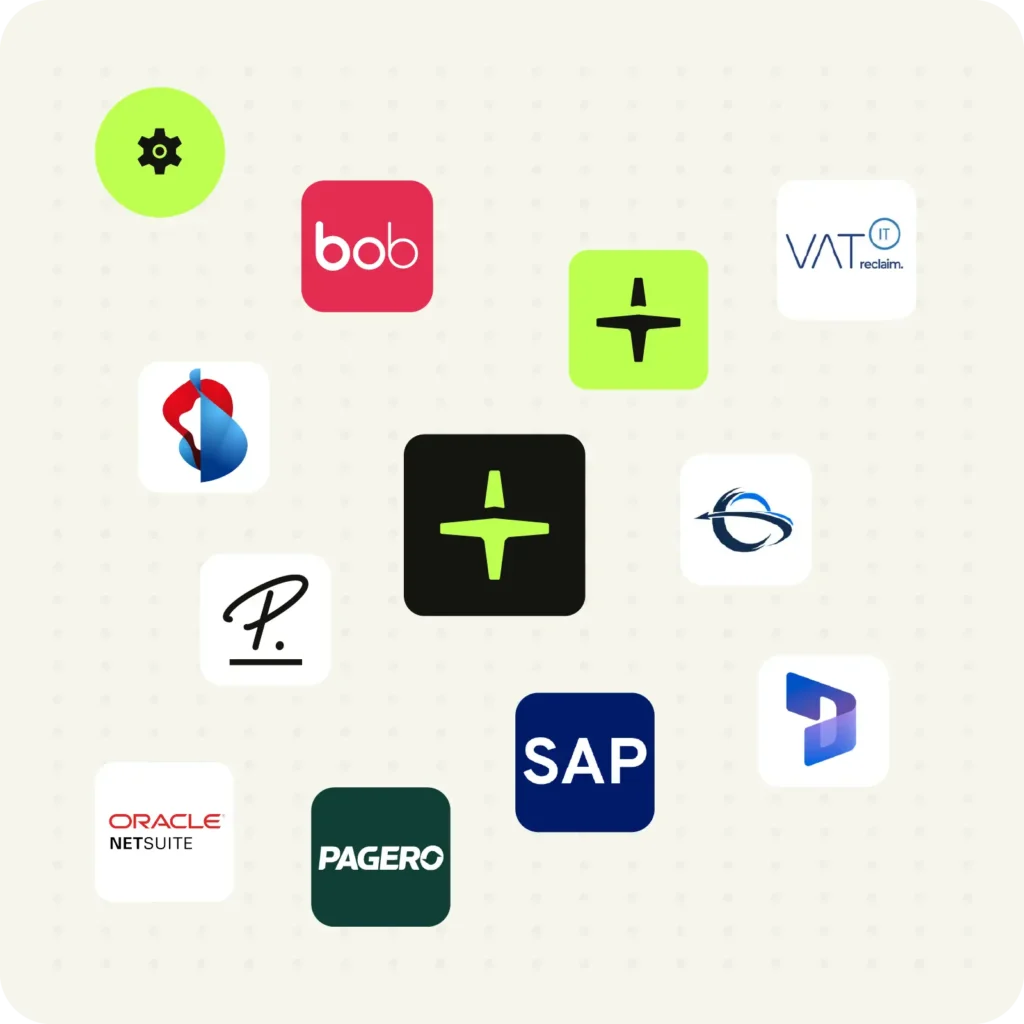
Streamline your IT landscape
Yokoy’s API facilitates seamless integrations with enterprise-level systems for end-to-end automation across entities and geographies.
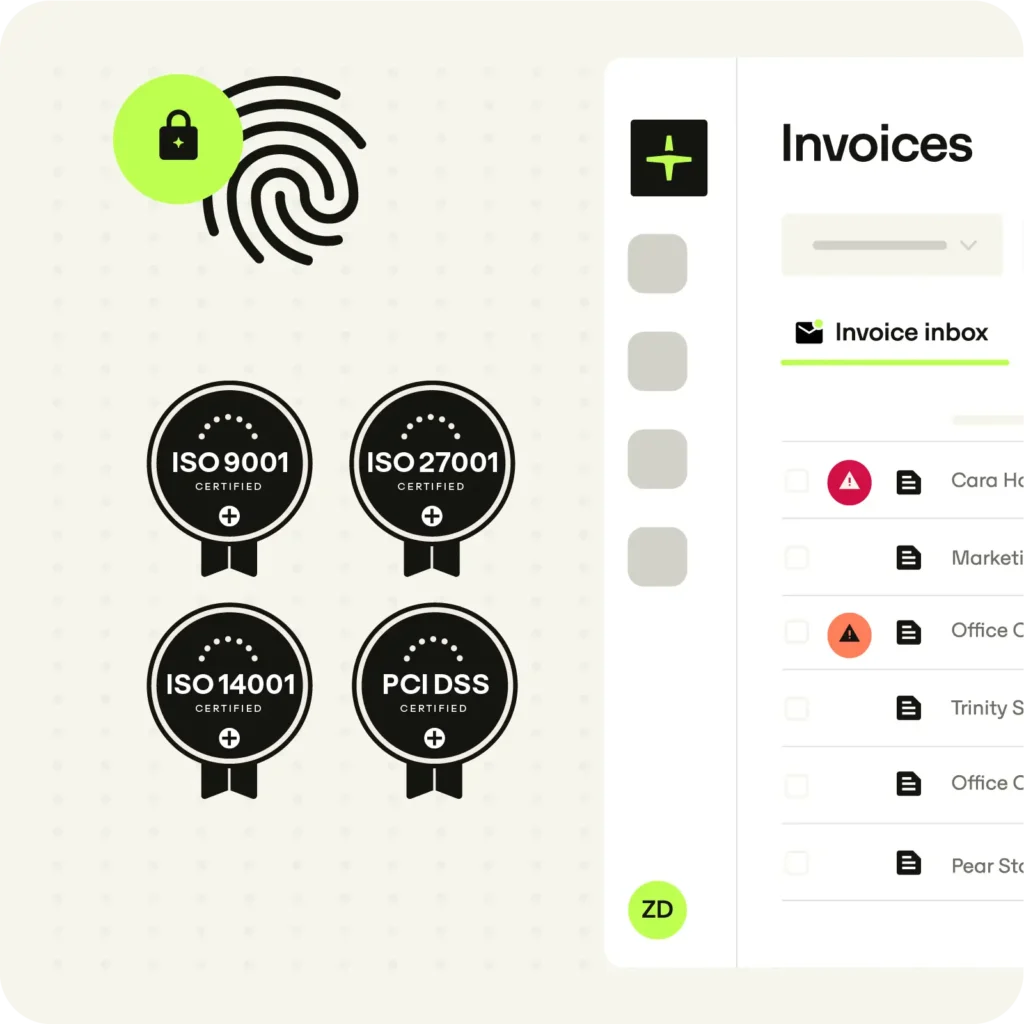
Stay safe, with the highest security standards
Yokoy is engineered for security and committed to information protection. We are ISO 9001, ISO 14001, ISO 27001, and GoBD compliant, as well as GDPR certified.
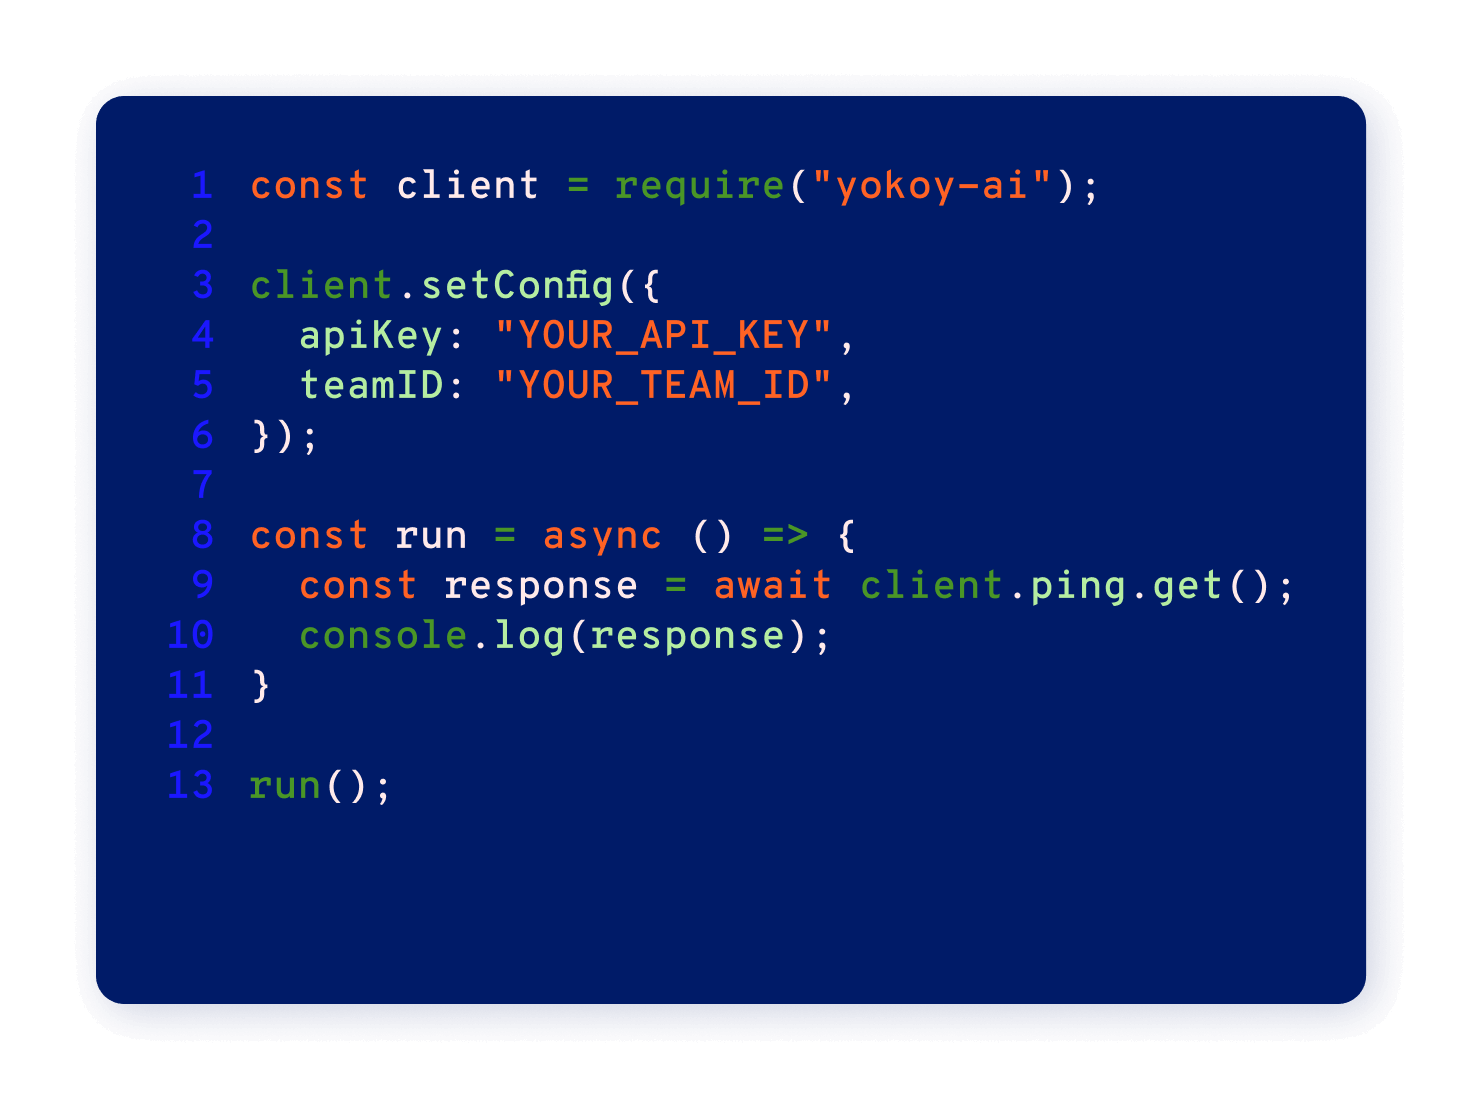
Yokoy API
API by developers, for developers
Yokoy’s engineers have created a free open API for you to build on top of Yokoy’s software and to connect your favorite tools and databases to the Yokoy platform.
What our customers say
Simplify your invoice management
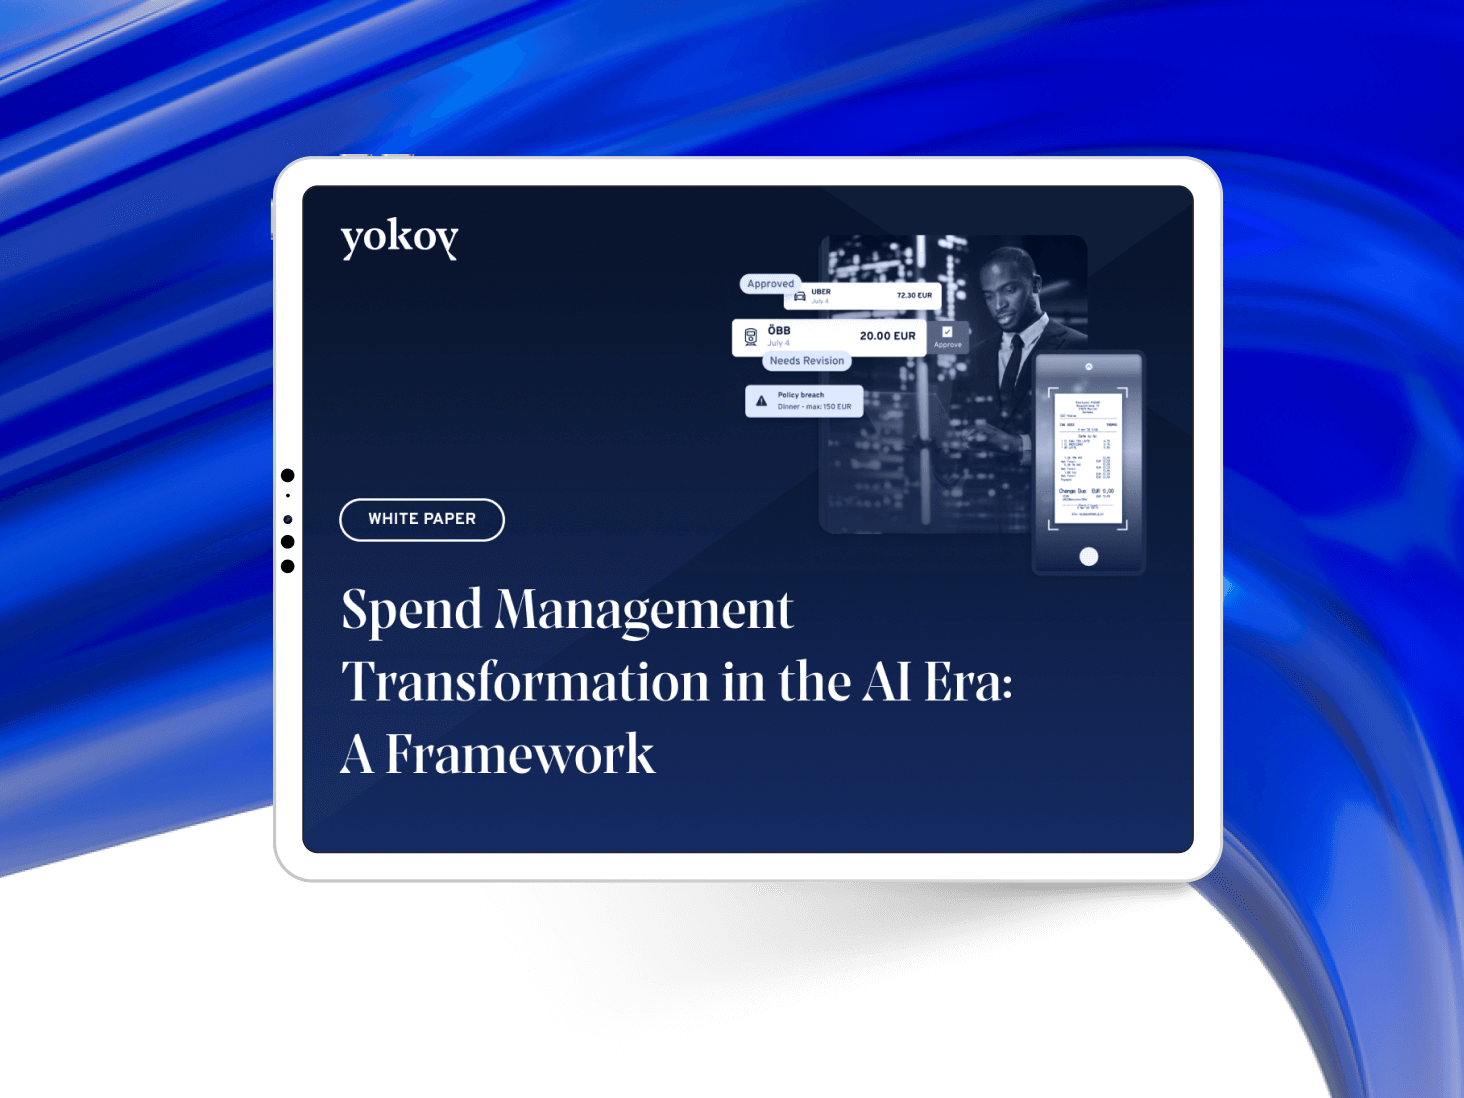
Book a demoWhite paper
Spend Management Transformation in the AI Era: A Framework
In the era of AI-driven digital transformation, traditional finance processes are becoming obsolete. As companies grapple with increasing complexities and rising competition, they must recognise the transformative potential of artificial intelligence to stay ahead of the curve.
The Yokoy impact
See how we contribute to our customers’ success stories.


Frequently asked questions
Yes, you can buy each Yokoy module separately. However, using the full suite provides greater benefits, as you can manage your expenses, invoices, and card payments in one central platform, and you can reduce system and data silos by simplifying ERP integrations.
Yes, Yokoy integrates with more than 50 solutions, automating your entire spend management process from end to end. At the same time, our API makes it easy to build custom integrations, if you can’t find what you’re looking for. Check our Integrations page for more details.
Yes, although we serve both midsize and large customers, Yokoy’s added value is best experience by global enterprise customers. Our suite is built for complex, global multi-entity configurations, and integrates with most enterprise ERP & HRM tools such as SAP R3/S4 and Successfactors, among others.
This depends on your IT landscape and the required configurations and integrations. For example, a global implementation with 2 legal entities, an ERP system integration, credit card integrations, and SSO setup takes about 2 months. The projects are carried out either by the Yokoy Services team or a certified Implementation Partner.
Yes, our Implementation team will lead the project from planning to implementation and testing, and will coordinate training workshops for your team. Global enterprise customers benefit from a dedicated Key Account Manager and financial process consulting from our in-house finance experts.
We use modern data encryption standards for both stored data and data in transit. Additionally, we work with external penetration testers (hackers) to constantly challenge our platform’s vulnerabilities. We adhere to local regulations such as GDPR in the EU or the Swiss Data Protection Act, to deliver the best data protection standards.
Given that no two setups are the same, we’ll discuss your specific needs during the sales process, and provide you with a tailored offer that ensures you’ll get the most out of our spend management suite.
See spend management in action
Gain full visibility and control over your business spend with AI-powered automation.
Book a demo