Home / Mastering Spend Analytics in Procure-to-Pay: Main KPIs to Track
Mastering Spend Analytics in Procure-to-Pay: Main KPIs to Track
- Last updated:
- Blog
Growth Marketing Manager
In this guide, we’ll explore the essential spend analytics KPIs that provide insights into how your organization spends money.
These insights can lead to cost savings, improved relationships with suppliers, and smarter procurement strategies. By understanding and using spend data effectively, you can make your P2P process more efficient and enhance your organization’s financial well-being.
What is spend analytics?
Spend analytics is the systematic process of collecting, cleansing, categorizing, and analyzing an organization’s expenditure data to gain valuable insights into spending patterns, vendor performance, and procurement efficiency.
It involves the meticulous examination of financial records, purchase orders, invoices, and other financial documents to uncover opportunities for cost optimization, risk management, and process improvement.
What does a spend analysis include?
Here are the 4 main stages of spend analysis:
- data collection,
- data cleansing and validation,
- data enrichment and classification, and
- analysis and reporting.
Let’s take each of these states one by one and see what it entails.
Data collection
The initial stage involves gathering procurement and spending data from various sources within the organization.
This data may be stored in different formats and systems, from ERP and procurement tools to accounts payable software, expense management tools, or even Excel spreadsheets in more traditional companies.
The data collected typically includes:
Purchase Orders (POs): Information related to purchase orders, including order date, order amount, item descriptions, and the departments or individuals responsible for the purchases.
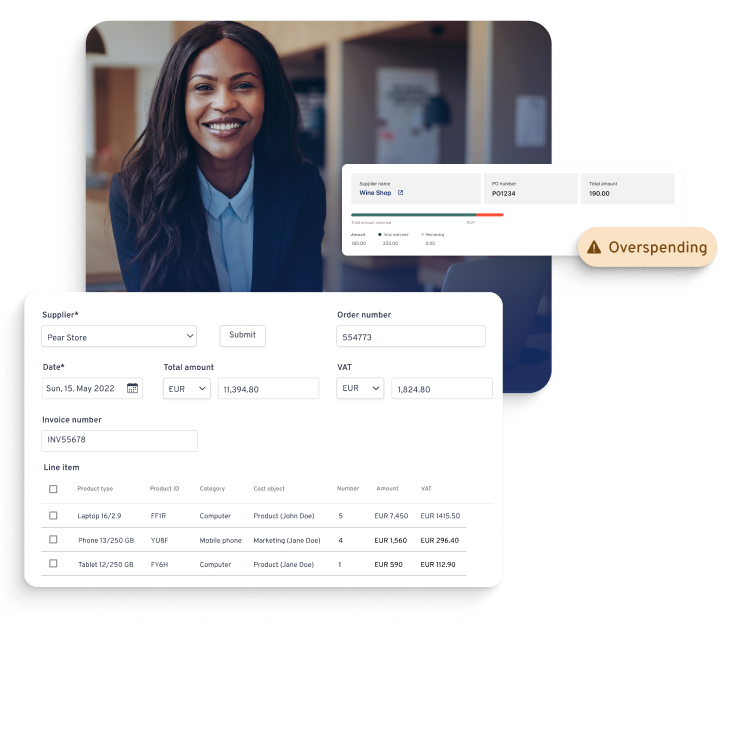
Invoices: Details of supplier invoices, such as invoice date, invoice amount, line item descriptions, and payment terms. Invoice data helps track accounts payable and spending commitments.
Expense reports: Data from employee expense reports, including travel expenses, meals, accommodations, and other reimbursable expenditures. This data helps identify travel and entertainment expenses.
Opinion
Maximizing Compliance through Automated Expense Reporting
Automated expense reporting has been gaining traction as a solution to help finance teams streamline their workflows and gain real-time insights into company expenses. But there’s one more area where automation can help tremendously: Staying compliant.

Lars Mangelsdorf,
Co-founder and CCO, Yokoy
Contracts: Information from contracts with suppliers, including contract terms, pricing, delivery schedules, and terms and conditions. This ensures more effective supplier management and enables strategic sourcing.
Supplier data: Data related to suppliers, such as supplier names, contact information, supplier classifications (e.g., diverse suppliers), and performance metrics.
Payment data: Details of payments made to suppliers, including payment dates, payment amounts, and payment methods. Payment data helps track cash flow and accounts payable and forecast more accurately.
Product or service descriptions: Descriptions of the products or services purchased, which can be categorized into spend categories (e.g., IT equipment, office supplies, professional services).
Transaction data: Granular transaction-level data that captures individual purchases, including the specific items or services purchased, quantities, and unit prices.
- Budget data: Information about budget allocations and spending against budgets or financial plans. This procurement data helps assess budget adherence.
Supplier performance metrics: Metrics evaluating supplier performance, such as on-time delivery, quality, lead times, and compliance with contract terms. This ensures more effective supplier management and enables strategic sourcing.
Spend categories: Classifying spending into meaningful groups or spend categories (e.g., direct materials, indirect spend, marketing expenses). A clear taxonomy with well defined spend categories is a prerequisite for spend management and procurement automation.
Currency exchange rates: Exchange rate information when dealing with international suppliers and multi-currency transactions.
Additional contextual data: Enrichment of spend data with contextual information, such as industry benchmarks, market trends, economic indicators, or stakeholder comments regarding suppliers.
Data cleansing and validation
Once the data is collected, it undergoes a cleansing process to eliminate errors, duplicates, and inconsistencies. Data validation ensures accuracy and reliability.
Some sub-steps in this stage include:
Accuracy verification: Data validation verifies the accuracy of the data by comparing it against trusted sources or predefined benchmarks. This ensures that the numbers recorded match the actual transactions.
Consistency checks: Consistency checks involve validating that data relationships are consistent. For example, ensuring that the total spending for a department matches the sum of its individual transactions.
Data integrity: Data integrity checks focus on preserving the consistency, accuracy, and reliability of the data throughout its lifecycle. This may involve the use of checksums or other methods to detect corruption.
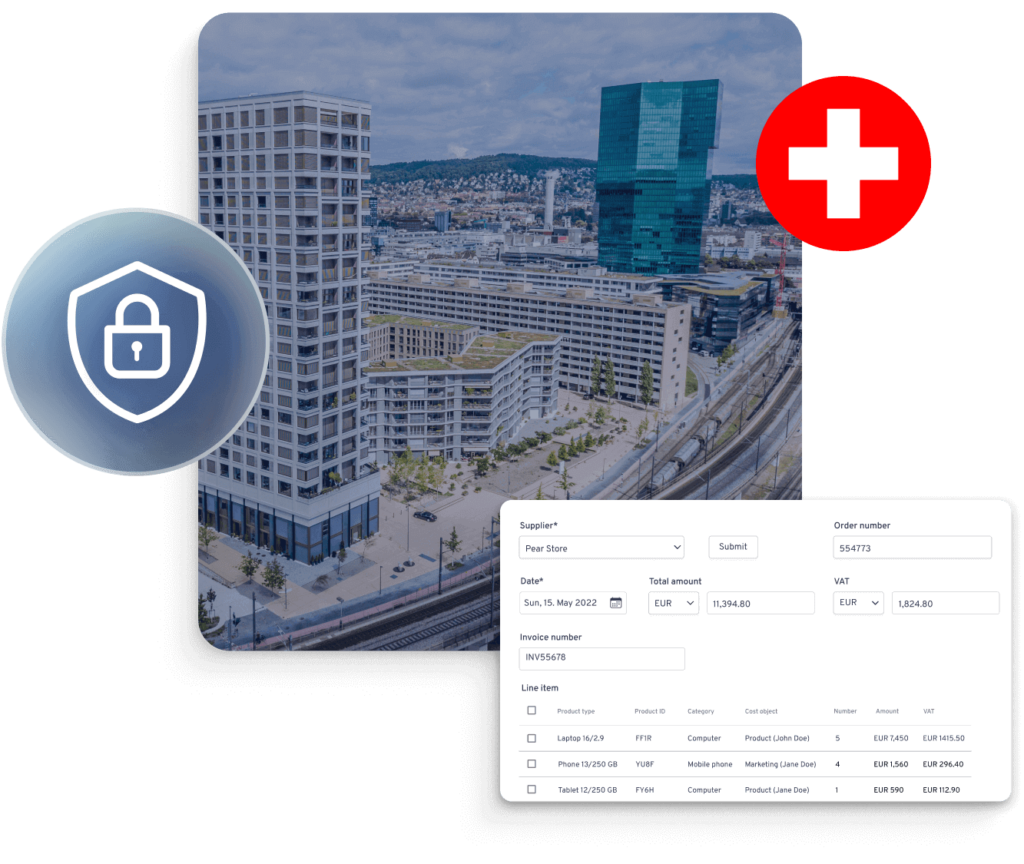
Compliance validation: Ensuring that the data complies with industry regulations, internal policies, and contract terms is critical. Validation checks confirm that spending aligns with predefined rules and compliance requirements.
Validation rules: Organizations often define validation rules and logic specific to their spend data. Automated data validation tools and scripts can streamline the process by automatically checking data against predefined rules and flagging issues for review.
Yokoy Compliance Center
Stay up-to-date with rules and regulations around per diem rates, mileage allowances, proof of receipt, and VAT rates, while Yokoy keeps you audit-ready across countries.
Data enrichment and classification
In this stage, the data is enriched with additional information, such as supplier details, product descriptions, and contract terms.
The spend data is also categorized into spend categories and classified based on supplier criteria. Common categories include office supplies, IT expenses, travel, and more.
Finally, suppliers are classified. Grouping suppliers based on various criteria, such as size, industry, or strategic importance. This classification aids in supplier performance evaluation.
Analysis and reporting
The final stage focuses on analyzing the cleaned, enriched, and categorized data. It involves the use of spend analytics tools to generate reports, dashboards, and visualizations that provide insights into spending patterns, cost-saving opportunities, supplier performance, and more.
Spend analytics solutions often provide features for spend and procurement data visualization, reporting, and advanced analytics.
But what types of insights are procurement teams typically trying to obtain? This depends on the KPIs, which may include cost savings, supplier performance, maverick spend rate, and more.
Generally, procurement teams are trying to achieve full spend visibility, including:
Savings identification: Identifying potential cost-saving opportunities, such as volume discounts, supplier consolidation, or process optimization.
Contract compliance assessment: Evaluating the extent to which procurement transactions adhere to established contracts and agreements.
Risk assessment: Assessing potential risks within the supply chain, including supplier risk assessment and financial stability, compliance risks, and supply chain disruptions.
Supplier performance evaluation: Evaluating supplier performance based on factors like on-time delivery, quality, and adherence to contract terms.
The end goal is to extract actionable insights from the analysis to inform strategic decisions, improve procurement processes, and achieve organizational goals. For this, building clear procurement dashboards that offer data visualizations in various formats is essential, as it facilitates easier understanding and decision-making.
These four stages form a structured approach to spend analysis, allowing organizations to transform raw data into actionable insights that can drive informed decision-making and procurement optimization.
Check out our newsletter
Don't miss out
Join 12’000+ finance professionals and get the latest insights on spend management and the transformation of finance directly in your inbox.
Main spend analytics KPIs to track
Here are some of the main spend analytics KPIs to track:
Savings percentage: Calculate the percentage of cost savings achieved through procurement and spend optimization initiatives. This KPI measures the effectiveness of your cost reduction efforts.
Supplier performance score: Evaluate your suppliers’ performance based on criteria like on-time delivery, quality, and adherence to contract terms. A supplier performance score helps identify reliable partners.
Spend under management: Measure the percentage of your total spend that is actively managed through procurement processes. A higher percentage indicates better control over spending.
Maverick spend rate: Track the percentage of spending that occurs outside established procurement policies and processes. Reducing maverick spend can lead to significant cost savings.
Procurement cycle time: Calculate the average time it takes to complete the procurement process, from requisition to payment. A shorter cycle time can improve efficiency and reduce operational costs.
Contract compliance rate: Assess the extent to which procurement transactions adhere to established contracts and agreements. High contract compliance ensures that negotiated terms are met.
Supplier diversity score: Evaluate your organization’s commitment to supplier diversity by measuring the percentage of spend allocated to diverse suppliers, such as minority-owned or women-owned businesses.
Cost avoidance: Estimate the costs that have been avoided through proactive procurement actions, such as renegotiating contracts or identifying alternative suppliers.
Purchase price variance (PPV): Monitor the variance between the expected purchase price and the actual price paid for goods and services. PPV can highlight potential cost discrepancies.
Sourcing savings: Measure the savings generated through strategic sourcing initiatives, such as supplier consolidation, volume discounts, or global sourcing.
Spend by category: Analyze spending patterns by category, allowing you to identify areas where cost reduction or optimization efforts are needed most.
Spend by department or Business Unit: Break down spending by department or business unit to identify areas of high expenditure and potential opportunities for consolidation or cost reduction.
Challenges in spend analysis
Numerous challenges can hinder its effective implementation. Understanding these challenges is the first step towards overcoming them:
- Data silos: One of the primary challenges is the presence of data silos within an organization. Data may be scattered across various departments, systems, and formats, making it difficult to consolidate and analyze effectively.
- Insufficient analytics capabilities: Many organizations lack the necessary tools and expertise to perform advanced spend analytics. Without the right technology and skilled personnel, extracting meaningful insights becomes challenging.
- Lack of knowledge and resistance to change: Implementing spend analytics often requires a cultural shift within an organization. Resistance to change and a lack of awareness about the benefits of spend analytics can impede progress.
In the following sections, we’ll explore strategies to overcome them, enabling organizations to harness the full potential of spend analytics.
How do you analyze spend data? Steps to get started
Embarking on the journey of implementing spend analytics can be a transformative experience for your organization. It’s a strategic step toward gaining better control over spending, optimizing operations, and making data-driven decisions.
Here’s a guide on how to get started with spend analytics.
- Define your objectives: What do you hope to achieve with spend analytics? Are you looking to reduce costs, improve supplier relationships, enhance compliance, or all of the above? Understanding your goals is essential for a successful implementation.
- Assemble a team: Build a dedicated team responsible for implementing and managing spend analytics. This team should include professionals with expertise in procurement, data analysis, and technology.
- Select the right technology: The choice of technology should align with your organization’s size, complexity, and specific needs. It should be capable of handling your data sources and provide the desired analytics capabilities.
- Identify spend data sources and clean the data: The foundation of spend analytics is data. Identify all the sources of spending data within your organization, and prepare the data by cleaning, validating, and standardizing it to ensure accuracy and consistency.
- Establish data governance: Implement data governance practices to maintain data quality and integrity. Define data ownership, access controls, and data validation rules. This step is crucial for ongoing data reliability.
- Create spend categories: Categorize your spend data into meaningful groups or spend categories. This step is essential for organizing and analyzing data effectively. Common categories include office supplies, IT expenses, travel, and more.
- Supplier classification: Grouping suppliers based on various criteria, such as size, industry, or strategic importance. This classification aids in supplier performance evaluation.
- Data enrichment: Enhance your spend data with additional information, such as supplier details, product descriptions, and contract terms. This enrichment provides context for your analysis and helps identify opportunities for improvement.
- Set KPIs: Define the key performance indicators that align with your objectives. These may include metrics like cost savings, supplier performance, procurement cycle time, and compliance rates.
- Implement analytics and reporting: Utilize your spend analytics software to run reports, conduct analyses, and visualize the data. Create dashboards and reports that provide actionable insights for decision-makers.
- Train your team: Provide training to your team members on how to use the spend analytics tools effectively. Ensure they understand how to interpret the data and leverage it for better decision-making.
- Monitor and benchmark: Implement a process for continuous improvement. Regularly review your spend analytics results, identify areas for enhancement, and adjust your strategies accordingly. Continuously monitor your spend analytics to track progress and identify deviations from your objectives. Benchmark your performance against industry standards or your own historical data.
Getting started with spend analytics requires careful planning, dedicated resources, and a commitment to data accuracy and analysis. It’s a journey that, when undertaken effectively, can lead to significant improvements in procurement and financial management within your organization.
How can spend analytics support procurement?
Spend analytics plays a pivotal role in the success and sustainability of organizations across industries. Understanding its significance is crucial for any business looking to make informed decisions, enhance efficiency, and stay competitive.
Here are several key reasons why spend analytics is of paramount importance.
Full visibility on spend
One of the primary benefits of implementing spend analytics within an organization is the attainment of full visibility on spend. This visibility represents a comprehensive and detailed understanding of where, how, and why an organization allocates its financial resources.
Organizations can assess supplier performance, track contract compliance, and ensure that suppliers meet agreed-upon terms and deliver quality goods and services.
Streamline operations
Streamlining operations through spend analytics leads to more efficient procurement processes. It eliminates redundant tasks, reduces manual interventions, and automates routine activities, resulting in faster and more streamlined operations.
By removing bottlenecks and reducing manual work, employees can allocate their time more effectively. This time-saving aspect allows procurement professionals to focus on strategic activities, supplier relationship management, and value-added tasks.
Cost optimization
Spend analytics provides organizations with invaluable insights into their spending patterns, helping them find savings opportunities.
By identifying areas of excessive or unnecessary expenditure, companies can take strategic actions to reduce costs, improve budget allocation, and boost profitability.
Supplier performance management
With the ability to evaluate vendor performance, organizations can ensure that they are working with reliable and efficient suppliers. Organizations can assess supplier performance, track contract compliance, and ensure that suppliers meet agreed-upon terms and deliver quality goods and services. This, in turn, leads to improved supplier relationships, better contract negotiations, and enhanced product and service quality.
Risk mitigation
Spend analytics allows organizations to identify and manage potential risks within their supply chain. By monitoring supplier compliance and financial stability, companies can proactively address issues, minimize disruptions, and safeguard their operations.
Process efficiency
Streamlining procurement processes is a key benefit of spend analytics. It helps organizations eliminate bottlenecks, reduce manual tasks, and enhance operational efficiency, leading to faster procurement cycles and cost savings.
Strategic decision-making
Data-driven insights from spend analytics empower executives and procurement professionals to make strategic decisions. These decisions may involve entering new markets, diversifying suppliers, or optimizing sourcing strategies for better long-term outcomes.
Simplified and efficient operations mean that decisions can be made more rapidly. This agility is especially important in fast-paced industries where timely decisions can make a significant difference in procurement outcomes.
Compliance and transparency
Maintaining compliance with internal policies and external regulations is a priority for businesses. Spend analytics ensures that organizations can monitor adherence to rules and regulations, fostering transparency and accountability.
Improved budgeting and planning
Accurate spend data is essential for effective budgeting and financial planning. Spend analytics helps organizations allocate resources optimally, aligning budgets with strategic goals and ensuring financial stability.
Now that we’ve established the importance of spend analytics, let’s explore the challenges that organizations often encounter when trying to harness the full potential of spend analysis.
Next steps
In conclusion, having clarity on spend data is an indispensable asset for any organization. It enables informed decision-making, promotes cost efficiency, and enhances supplier relationships.
Clarity in spend data helps identify opportunities for savings, mitigate risks, and ensure compliance with regulations and policies.
By investing in data accuracy and reliability, organizations position themselves for more precise and strategic financial management, ultimately contributing to their long-term success and competitiveness in the market.
White paper
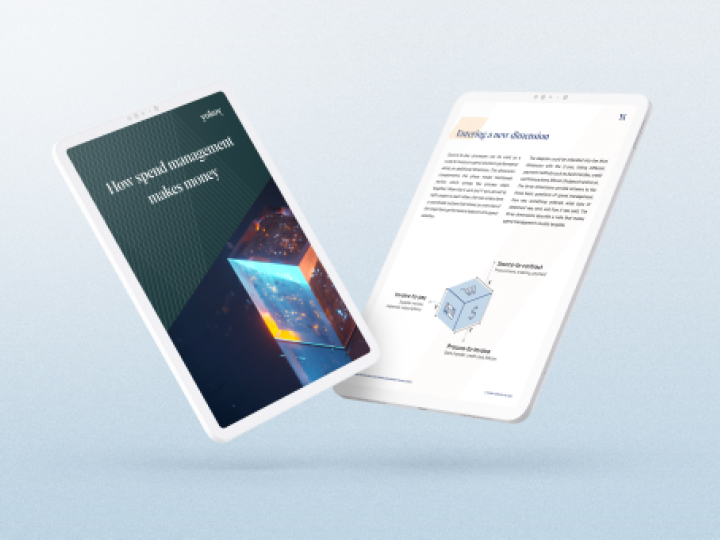
How Spend Management Makes Money
Spend management solutions provide benefits beyond cost savings, including improved spend control and fraud prevention.
Simplify your invoice management
Book a demoRelated content
If you enjoyed this article, you might find the resources below useful.

